Summary of Sleep Cycle Plots
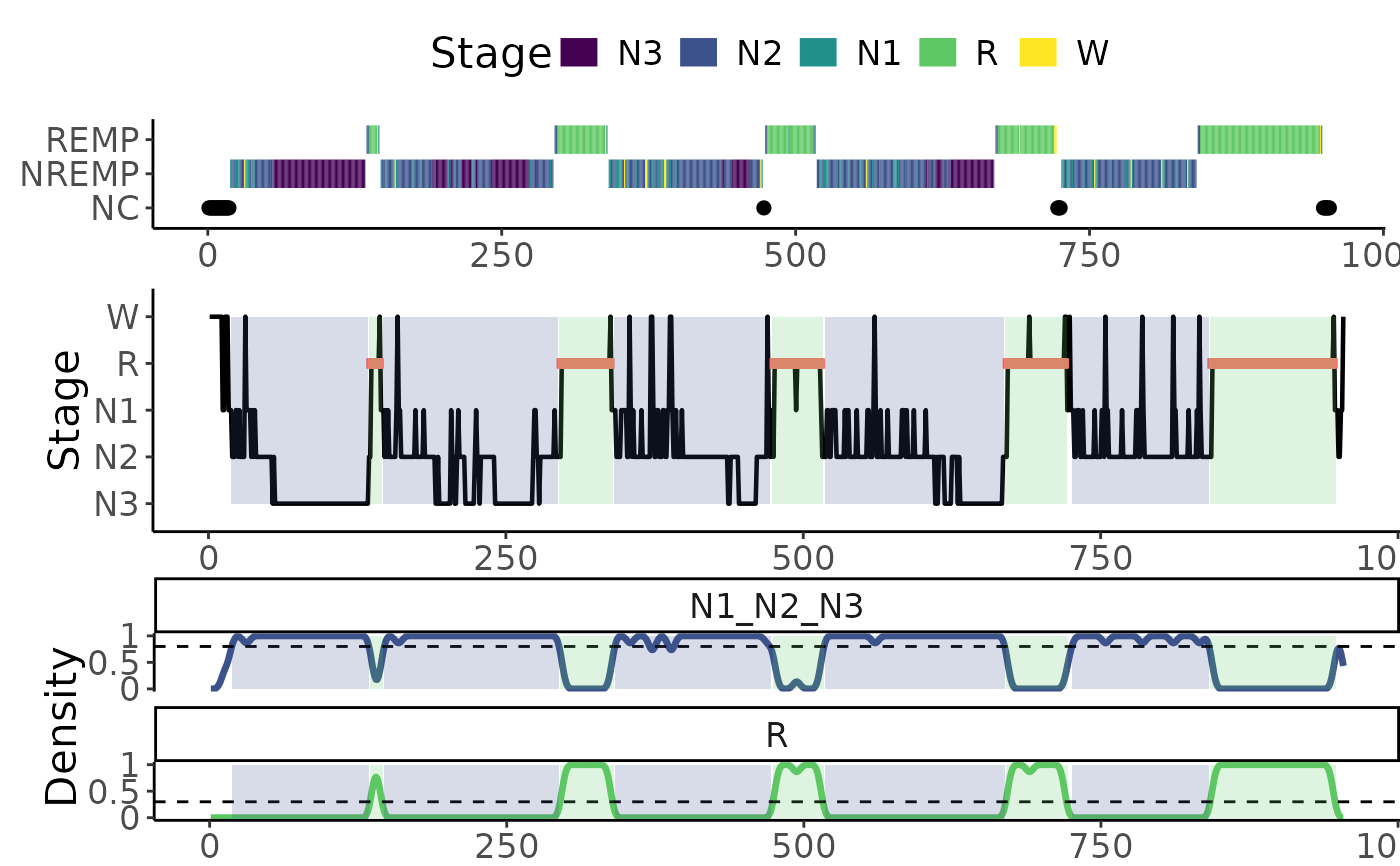
plot_summary.RdThis function generates a combined visualization of a hypnogram, sleep cycles, and, if using the 'dude' method for sleep cycles estimates, cycle densities.
Examples
data("hypnogram_single")
plot_summary(
  sleepcycles_from_hypnogram(
    hypnogram_single,
    epoch_col = "epoch",
    stage_col = "stage",
    method = "dude",
    verbose = FALSE
  )
)

plot_summary(
  sleepcycles_from_hypnogram(
    hypnogram_single,
    epoch_col = "epoch",
    stage_col = "stage",
    method = "feinberg",
    verbose = FALSE
  )
)
plot_summary(
sleepcycles_from_hypnogram(
hypnogram_single,
epoch_col = "epoch",
stage_col = "stage",
method = "feinberg",
verbose = FALSE
)
)
